Last night I was working on a talk on creating effective graphs. Mostly, I needed to update the colors, as there’d been some gaudy ones in its previous form (e.g., slide 22).
I usually pick colors using the crayons in the Mac Color Picker. But that has just 40 crayons, and I wanted more choices.
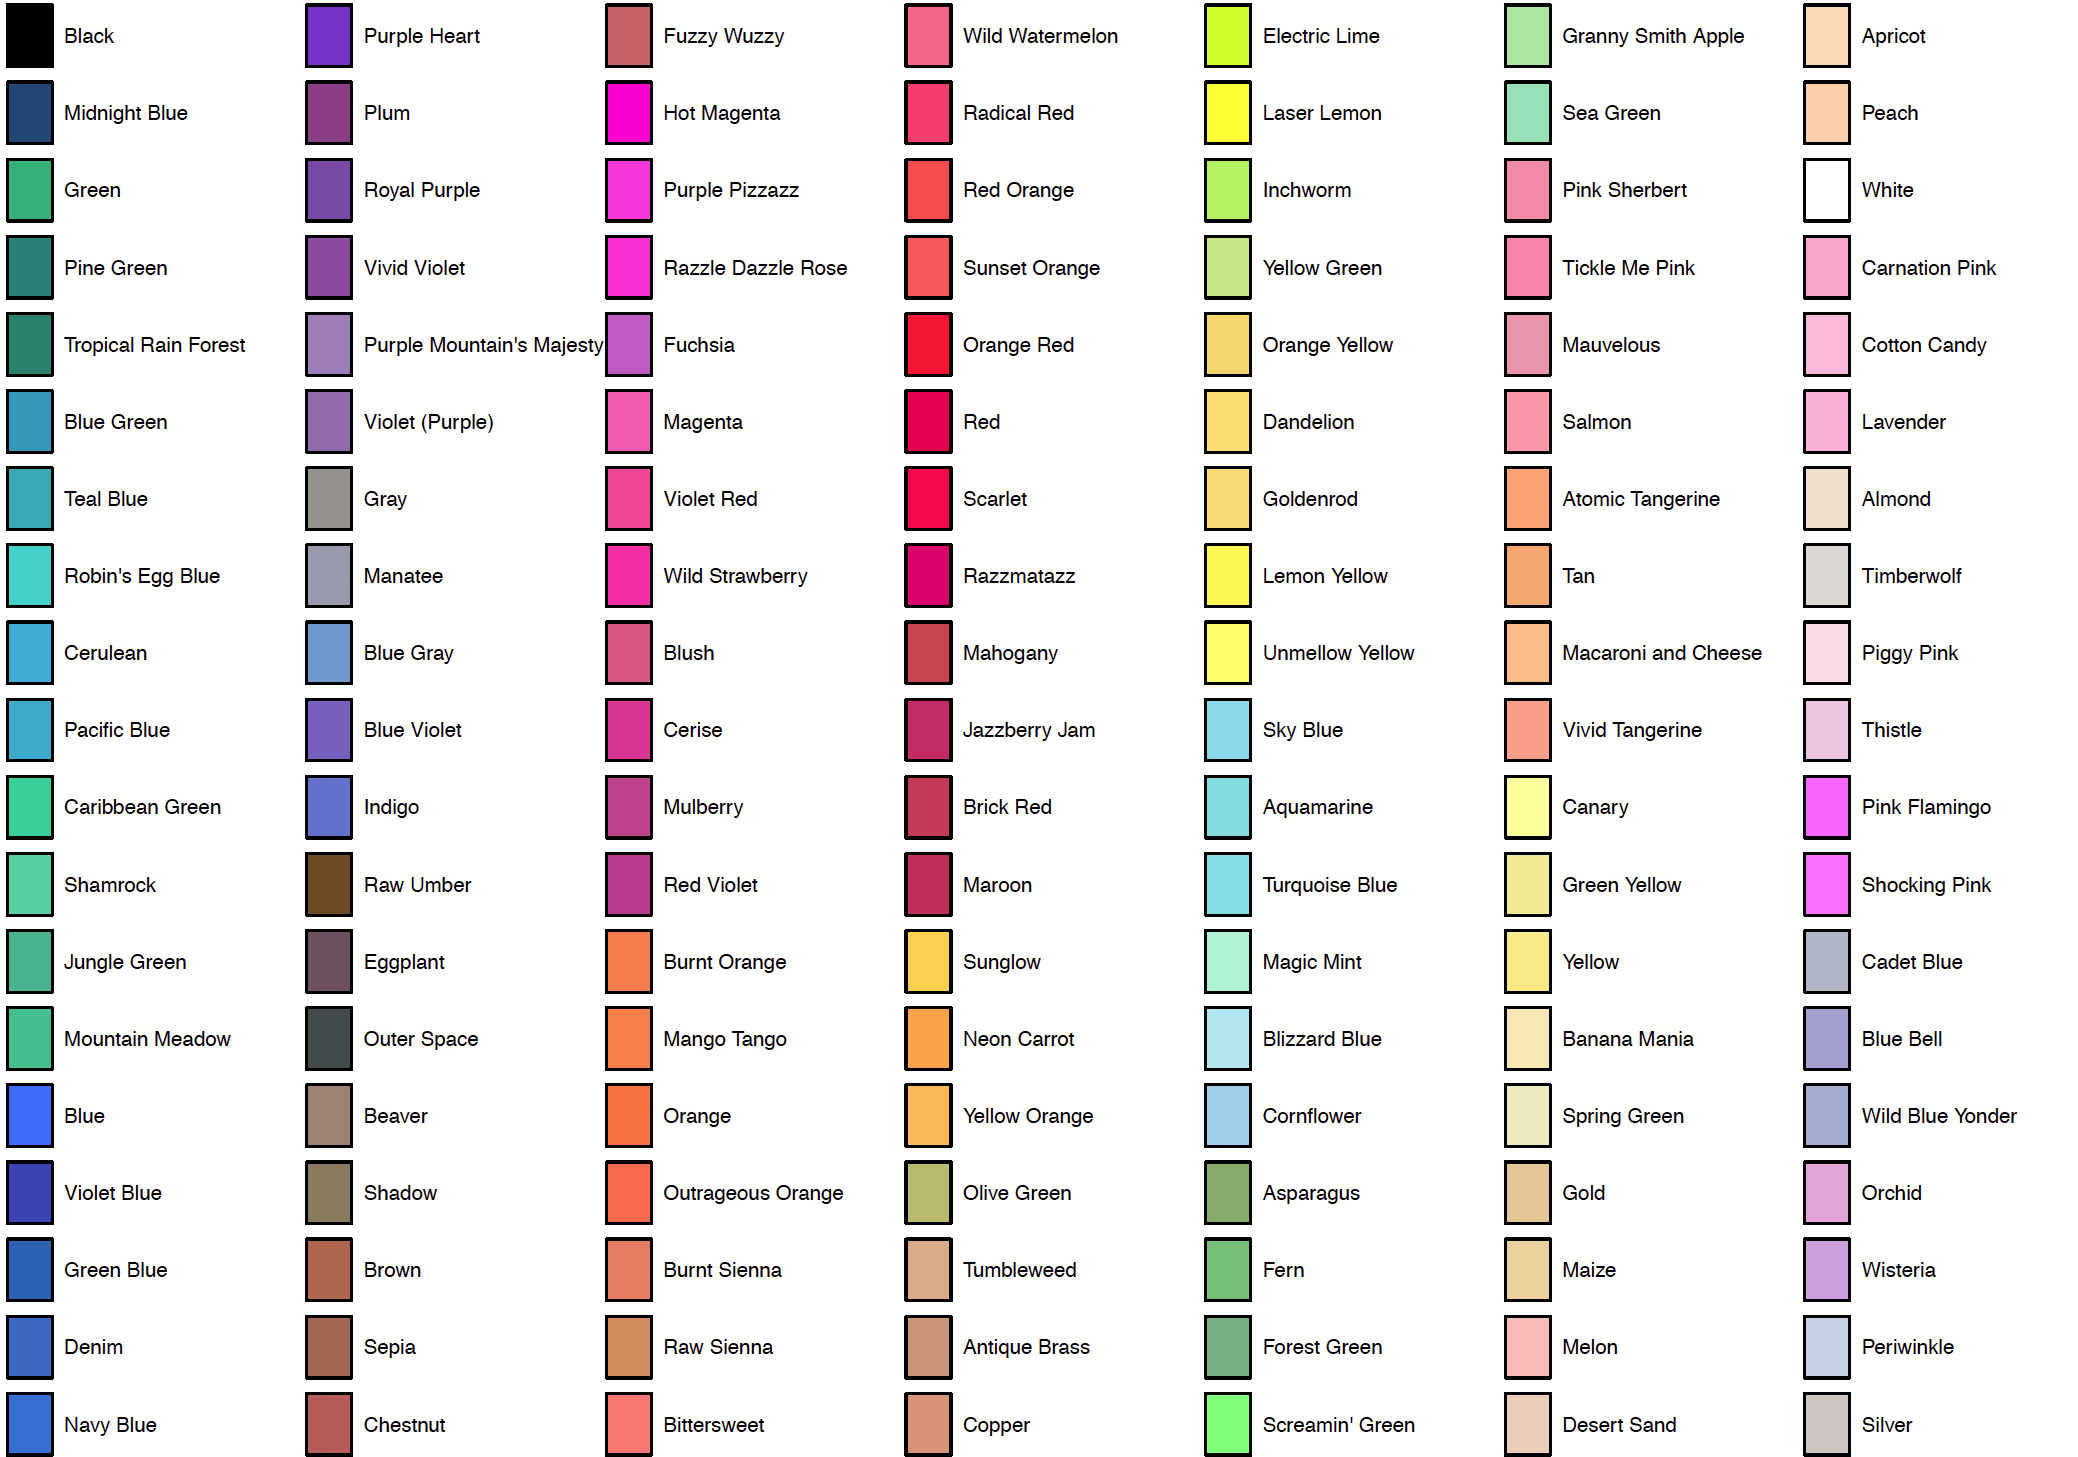
That led me to the list of Crayola crayon colors on wikipedia. I wrote a ruby script to grab the color names and codes and added them to my R/broman package.
Use brocolors("crayons") to get the list of colors. For example, to get “Tickle Me Pink,” use
library(broman)
pink <- brocolors("crayons")["Tickle Me Pink"]
Use plot_crayons() to get the following summary plot of the colors:
You can install the R/broman package using install_github in devtools, (specifically, install_github("kbroman/broman")) or wait a day or two and the version with this code will be on CRAN.
Update: See also Two more points about crayon colors.

7 May 2014 at 1:57 pm
Very nice, I’m keen to give it a try.
> library(“broman”)
> pink <- brocolors("crayons")["Tickle Me Pink"]
Error: could not find function "brocolors"
Tried this: install.packages("broman", type = "source"), got this: broman_0.48-2.tar.gz, but still the Error message above. Any other packages needed? Am I forgetting something obvious? Thanks.
7 May 2014 at 2:00 pm
install_github(“kbroman/broman”)
ends with:
Warning message:
package ‘’ is not available (for R version 3.1.0)
7 May 2014 at 2:06 pm
Weird; does packageVersion(“broman”) indicate 0.48.2? Can you use any of the other functions in the package? For example, dec2hex(200)
I’m having similar problems with install_github. I’m not sure what’s up.
7 May 2014 at 2:08 pm
If I use remove.packages(“broman”) and then install_github(“kbroman/broman”), I still get that warning, but it does work.
8 May 2014 at 4:35 am
Karl: you’re right. Beautiful palette, thanks for sharing!
7 May 2014 at 2:49 pm
I greatly appreciate your top 10 horrible figures… perhaps also an example of the peer review process gone awry!
29 Nov 2017 at 11:03 am
Is it possible to use your broman package to use crayon colors in a plot like a bar chart? How would I define or call the color?
29 Nov 2017 at 1:36 pm
crayons() gives you a vector with all of the colors.
Or give it some partial names to get a vector of chosen colors.
my_colors <- crayons(c("tickle", "cadet", "robin", "apricot", "outrageous"))
Use it in barplot() via the col argument, like so:
my_data <- setNames( runif(5, 0, 20), LETTERS[1:5])
barplot(my_data, col=my_colors)
30 Nov 2017 at 11:05 am
Thanks, can’t wait to try it!